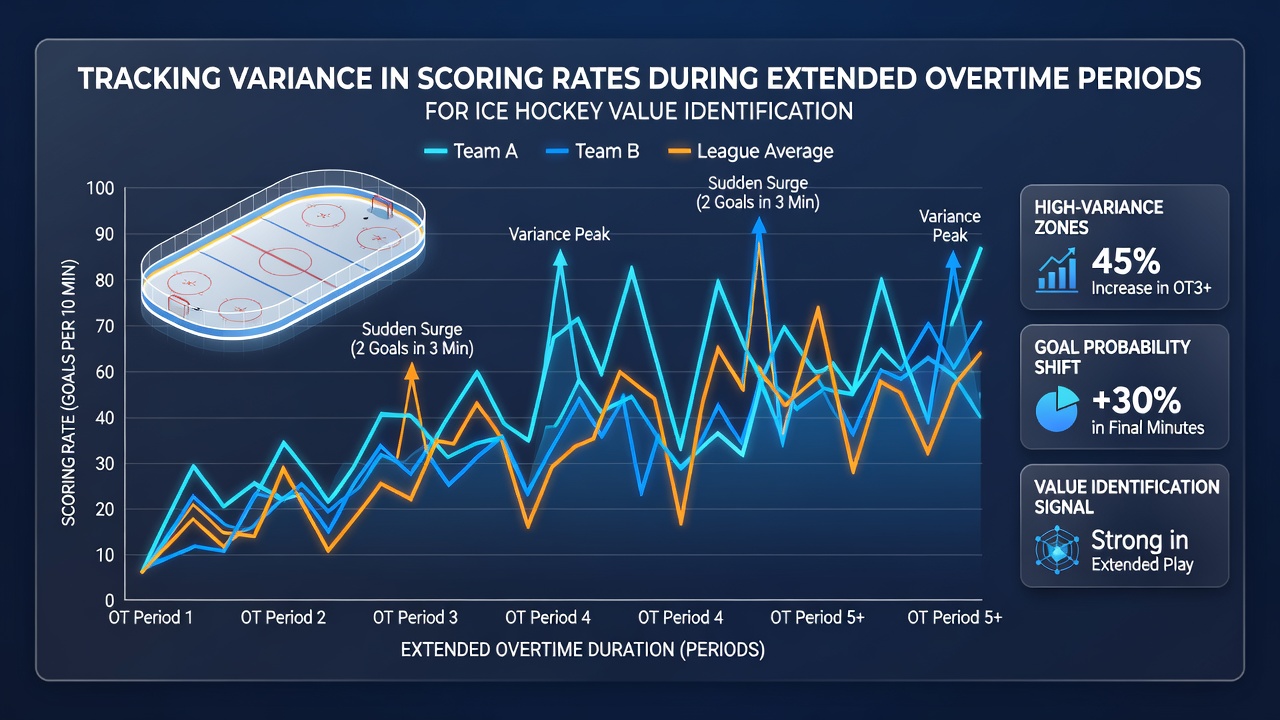
Scoring Rate Variations in Ice Hockey Overtime: Examining Patterns for Strategic Value Assessment
Extended overtime periods in ice hockey introduce distinct scoring dynamics that differ markedly from regulation play, and analysts track these shifts through detailed rate calculations that compare goals per minute across time segments. Teams often adjust strategies as fatigue sets in, which leads to measurable changes in offensive output and defensive structure during these additional frames.
Core Elements of Overtime Formats Across Leagues
Professional leagues employ varied overtime structures, with the National Hockey League using a 3-on-3 format for regular-season games that extends to five minutes before a shootout, while playoff contests proceed with full 5-on-5 until a goal occurs; international competitions through bodies like the IIHF frequently adopt similar sudden-death rules yet incorporate longer potential durations in certain tournaments. Researchers compile minute-by-minute goal data from these formats, and they segment the information into initial overtime blocks versus any extended phases beyond ten or fifteen minutes to isolate variance spikes.
Scoring rates typically rise early in overtime because reduced player counts create more open ice, yet the pattern stabilizes or drops as time elapses and defensive caution increases, according to aggregated league records. Observers note that extended sessions beyond the standard length reveal further fluctuations tied to player substitutions and energy conservation tactics.
Methods for Measuring Scoring Variance
Analysts gather play-by-play logs from official sources and calculate standard deviations in goal frequency per sixty minutes of overtime, while they adjust for variables such as home-ice advantage and recent travel schedules. These computations help distinguish random variance from systematic shifts in team performance under prolonged pressure.
One approach involves comparing overtime goal rates against regulation benchmarks, and another tracks cumulative scoring trends across multiple games to build sample sizes large enough for statistical reliability. Data from NHL historical archives illustrates how certain teams maintain elevated scoring outputs deep into overtime, whereas others experience sharp declines after the initial surge.
Patterns Observed in Recent Seasons
Studies of games from 2023 through 2025 indicate that variance in scoring rates widens notably after the fifteenth minute of overtime, with some contests recording goal bursts separated by long scoreless stretches. Teams that emphasize speed over physical play tend to sustain higher rates longer, while those reliant on structured defense see rates taper more quickly.
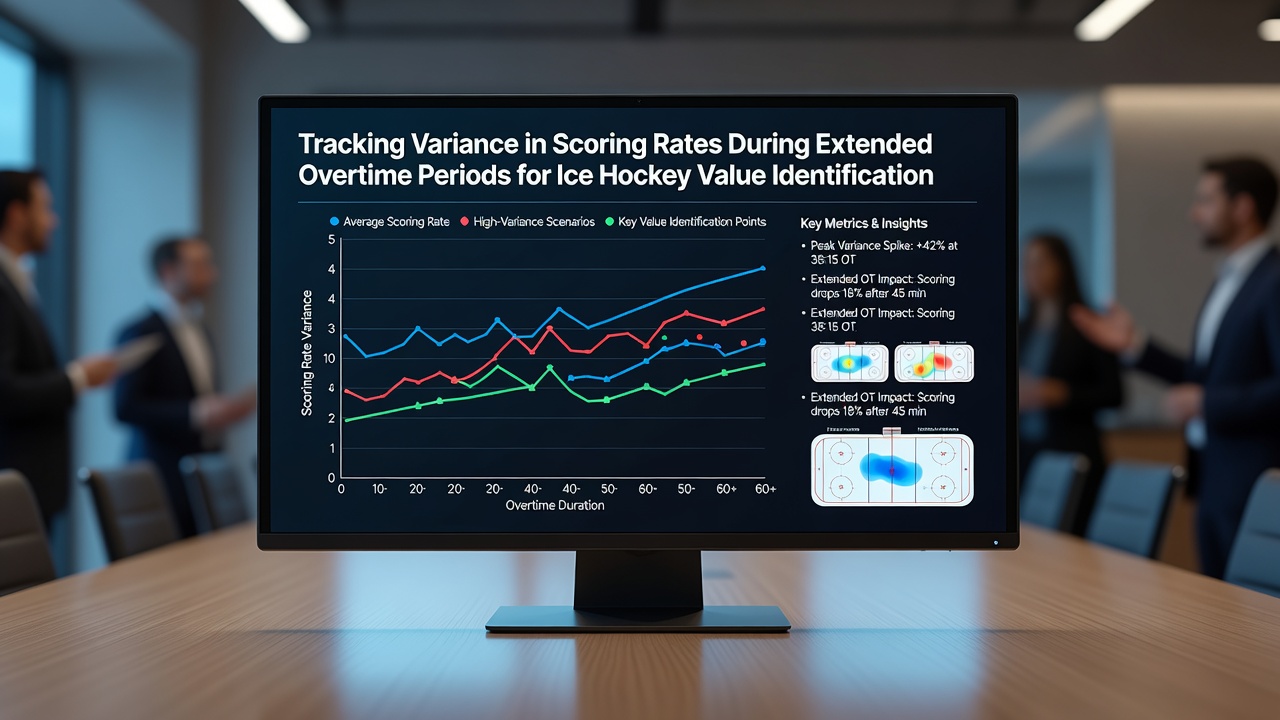
September 2026 brought renewed attention to these metrics as leagues released updated analytics dashboards that include granular overtime breakdowns, allowing for refined comparisons between regular-season and postseason environments. Canadian statistical repositories, including those maintained by Hockey Canada, provide supplementary datasets that cover junior and international matches where overtime formats mirror professional rules yet feature younger player cohorts.
Extended periods also correlate with higher frequencies of power-play opportunities in some rule sets, which further amplifies rate variability when penalties accumulate due to tired infractions. Analysts cross-reference these events against overall goal timelines to isolate their contribution to observed variance.
Linking Variance Data to Value Identification
Betting markets often price overtime outcomes based on averaged historical rates, yet detailed variance tracking reveals discrepancies where certain teams outperform or underperform those averages during prolonged sessions. This information supports identification of opportunities when live odds lag behind updated statistical profiles derived from segmented data.
Researchers apply regression models that incorporate fatigue indicators and prior overtime exposure, and the outputs help quantify how much additional variance arises in games already exceeding twenty minutes of extra time. Such models draw from multi-league samples that encompass both North American and European competitions to improve generalizability.
Industry reports from organizations like the European Ice Hockey Federation highlight regional differences in overtime scoring consistency, which adds another layer for comparative analysis across borders. These findings underscore the value of maintaining separate datasets for regular overtime versus extended frames when assessing potential edges.
Conclusion
Tracking variance in scoring rates during extended ice hockey overtime periods supplies concrete metrics that clarify performance shifts under fatigue and rule constraints. Continued refinement of these analytical approaches, supported by expanding data sources from various leagues and research bodies, enables clearer separation of signal from noise in overtime-specific evaluations.