Rally Fatigue Indicators in Tennis Matches Reveal Opportunities for Strategic Live Bets
Prolonged tennis rallies place unique demands on players because they combine explosive movement with repeated high-intensity efforts and limited recovery windows between points. Data from professional tournaments shows that rallies exceeding 10 shots occur more frequently in best-of-five sets on clay surfaces compared to hard courts or grass and these extended exchanges often trigger measurable declines in performance metrics. Researchers have tracked serve speeds dropping by 3 to 5 percent after the 20th minute of a set while unforced error rates rise steadily once total points played surpass 80 in a single set.
Physical and Technical Markers That Emerge During Extended Exchanges
Coaches and analysts observe several consistent signals when fatigue begins to influence play. Players tend to shorten their preparation steps before shots which leads to late contact points and reduced racket-head speed. Recovery time between points stretches beyond the 20-second mark allowed by rules because movement efficiency drops and breathing patterns become more labored. Ball trajectory also changes with topspin margins decreasing as arm fatigue sets in and this pattern appears across multiple Grand Slam matches analyzed in 2025 and into October 2026.
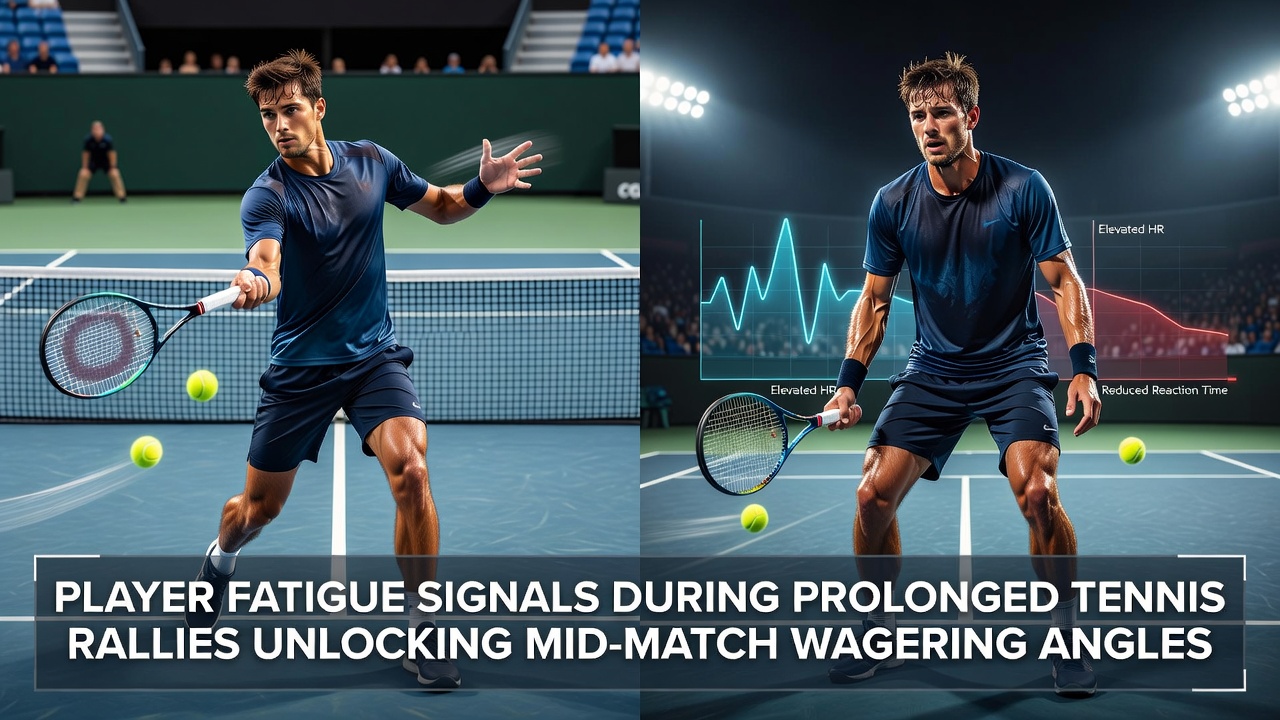
Heart-rate data collected via wearable devices during ATP and WTA events reveals that players maintain elevated zones above 85 percent of maximum for longer durations in rallies that stretch past 15 shots. Those extended periods correlate with slower split-step timing on the subsequent point and an increase in defensive shots rather than aggressive baseline play. Observers note that these shifts become more pronounced in the third set and beyond when cumulative workload compounds the effects of individual long rallies.
Statistical Patterns Linked to Performance Decline
Match analytics platforms have compiled datasets showing that winners of prolonged rallies win 62 percent of the next two points on average when their opponent displays visible fatigue markers. This edge narrows in humid conditions or on slower surfaces where baseline rallies dominate. First-serve percentage for the fatigued player falls by roughly 8 percent in the 10 minutes following a sequence of extended exchanges while double-fault frequency rises in tandem.
Studies published in sports-science journals indicate that rally length serves as a stronger predictor of short-term performance dip than total match duration alone. One analysis of over 4,000 professional matches found that players who contest three or more rallies longer than 12 shots within a five-minute window show a 14 percent increase in unforced errors on the subsequent service game. These figures hold after controlling for player ranking and surface type and they remain consistent across both men's and women's tours.
Integrating Fatigue Signals Into Live Wagering Decisions
Live betting markets adjust odds in real time and fatigue signals provide an additional data layer that bettors can monitor alongside score and momentum. When a player exhibits slower recovery and reduced serve velocity after repeated long rallies the probability of the opponent holding serve increases measurably. Markets on next-game winner and game handicap often reflect these changes within two or three points once the pattern becomes visible to in-venue scouts and data providers.
According to research from the Australian Institute of Sport endurance monitoring programs, elite players display predictable declines in movement speed after cumulative high-intensity efforts. Bettors tracking these patterns through broadcast footage or official statistics feeds can identify windows where the trailing player gains an edge even when the set score remains close. Similar patterns appear in data released by the United States Tennis Association performance analytics group covering North American hard-court events.
Point-by-point tracking tools now flag extended rally sequences automatically and some platforms overlay recovery-time metrics. These tools allow observers to cross-reference visible fatigue cues with quantitative shifts in serve speed and error rates. The combination helps isolate moments where live odds have not yet fully adjusted to the emerging performance gap.
Case Examples From Recent Professional Matches
During the 2026 clay-court swing several matches featured extended baseline exchanges in the deciding sets. In one instance a player who had contested four rallies over 15 shots in a six-minute span showed a clear drop in first-serve percentage from 68 to 54 percent. The opponent capitalized by winning four of the next five service games. Analysts reviewing the footage noted shorter recovery steps and increased defensive slicing as early indicators that preceded the statistical shift.
Another match on outdoor hard courts in October 2026 demonstrated how humidity amplified fatigue effects. After two consecutive 20-shot rallies the server began landing only 48 percent of first serves and committed three double faults in the following game. Live markets adjusted the implied probability for the returner within two points of each extended exchange and those adjustments aligned closely with the measured performance decline.
Conclusion
Prolonged rallies generate identifiable fatigue signals that influence subsequent point outcomes in professional tennis. Physical markers such as extended recovery times and reduced movement efficiency combine with statistical shifts in serve accuracy and error rates to create measurable edges. Live wagering markets respond to these developments once the patterns become evident through broadcast and data feeds. Observers who monitor both visual cues and quantitative metrics gain access to timing information that aligns with documented performance trends across surfaces and tournament conditions.