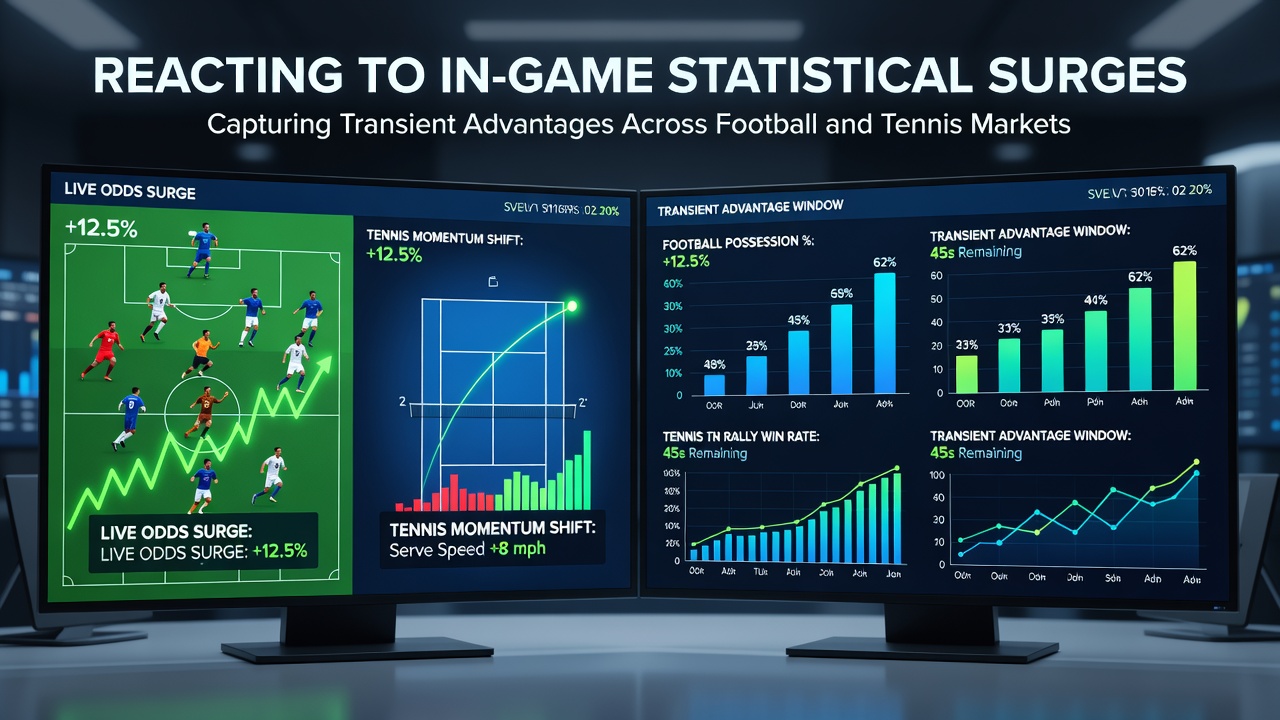
Live Statistical Surges: Identifying Fleeting Edges in Football and Tennis Markets
Market participants track real-time metrics such as expected goals, possession swings, and serve percentages to detect brief windows where odds lag behind evolving conditions, and these surges appear across both football and tennis contests when data streams update faster than bookmakers adjust lines. Observers note that football matches produce surges tied to shot volume clusters or defensive lapses, while tennis points generate spikes around break-point conversions and first-serve dominance shifts, each requiring rapid assessment tools that combine live feeds with historical benchmarks.
Defining In-Game Statistical Surges
Statistical surges represent concentrated deviations from baseline performance indicators, and researchers compile them from sources including player tracking systems and ball-event logs that update every few seconds during play. In football, a surge might register as a sudden rise in xG per 10-minute interval when a team increases high-quality entries into the penalty area, whereas tennis data captures similar patterns through rally length averages and unforced error rates that spike when fatigue affects one competitor. Data from the FIFA analytics reports shows these patterns recur across multiple leagues, with automated alerts flagging deviations exceeding two standard deviations from seasonal norms.
Participants who monitor these indicators often combine multiple data layers, including optical tracking and manual event tagging, to confirm whether a surge reflects genuine momentum or random variance. The process involves cross-referencing current values against pre-match models that account for venue, weather, and squad rotation effects, and this layered approach reduces false positives when odds move in response to the same underlying events.
Football Market Responses to Momentum Clusters
Football betting lines on total goals or next-team-to-score frequently adjust after sustained attacking sequences, yet delays of 30 to 90 seconds allow brief discrepancies when live data platforms register shot attempts before odds reflect the change. Analysts examine sequences such as corner counts per minute and progressive pass completion rates to time entries, and records from major European competitions indicate that teams generating three or more shots inside the box within five minutes see goal probability rise measurably above baseline. These windows close quickly once markets incorporate the updated information, requiring integration between data dashboards and exchange interfaces that support one-click placement.
Case examples from August 2026 fixtures illustrate how high-pressing sides create repeated surges in the final third, prompting temporary overround reductions on both teams to score markets, and participants who maintain pre-set thresholds for entry execute trades before the lines stabilize. Software filters that exclude low-sample intervals help isolate meaningful clusters from noise inherent in shorter time frames.

Tennis Point-by-Point Data Patterns
Tennis markets react to service game hold percentages and return point win rates that shift after consecutive service breaks or extended rallies, and ATP Tour data supplies granular updates that allow comparison against a player's career norms on the specific surface. A surge in first-serve points won above 75 percent over a three-game span often precedes price adjustments on game and set handicaps, creating intervals where live odds trail the statistical evidence. Observers record that these opportunities cluster around changeovers when players reset physically, and automated scripts that scan point-by-point feeds can highlight thresholds for market entry without manual intervention.
Additional layers include fatigue indicators derived from rally length distributions and error rates on second serves, which studies published in sports analytics journals link to measurable drops in hold probability during later sets. Market participants cross-reference these metrics with historical come-from-behind data to determine whether a surge represents a sustainable shift or a temporary fluctuation likely to regress.
Technical Requirements for Real-Time Execution
Latency between data providers and betting platforms determines how long a surge remains exploitable, and participants deploy co-located servers or low-latency APIs to minimize the gap between event occurrence and order submission. Integration of multiple feeds, including official league data and third-party modeling outputs, allows confirmation that a detected surge exceeds noise thresholds before capital allocation. Regulatory frameworks in several jurisdictions require operators to maintain minimum update intervals, yet private data services often deliver faster granularity that experienced users combine with exchange liquidity to capture short-lived mispricings.
Training protocols for teams monitoring these markets emphasize pattern recognition across historical match files rather than reliance on single indicators, and back-testing routines quantify the frequency and duration of profitable windows under varying market conditions. This systematic preparation supports consistent identification of transient advantages without dependence on discretionary judgment during live events.
Conclusion
Statistical surges in live football and tennis markets arise from measurable deviations in performance metrics that briefly outpace odds adjustments, and structured monitoring of these patterns supplies participants with defined entry criteria across both sports. Continued refinement of data integration methods and latency reduction tools sustains the viability of such approaches as markets evolve through 2026 and beyond.